Building Capacity for Data Visualization
data visualization
R
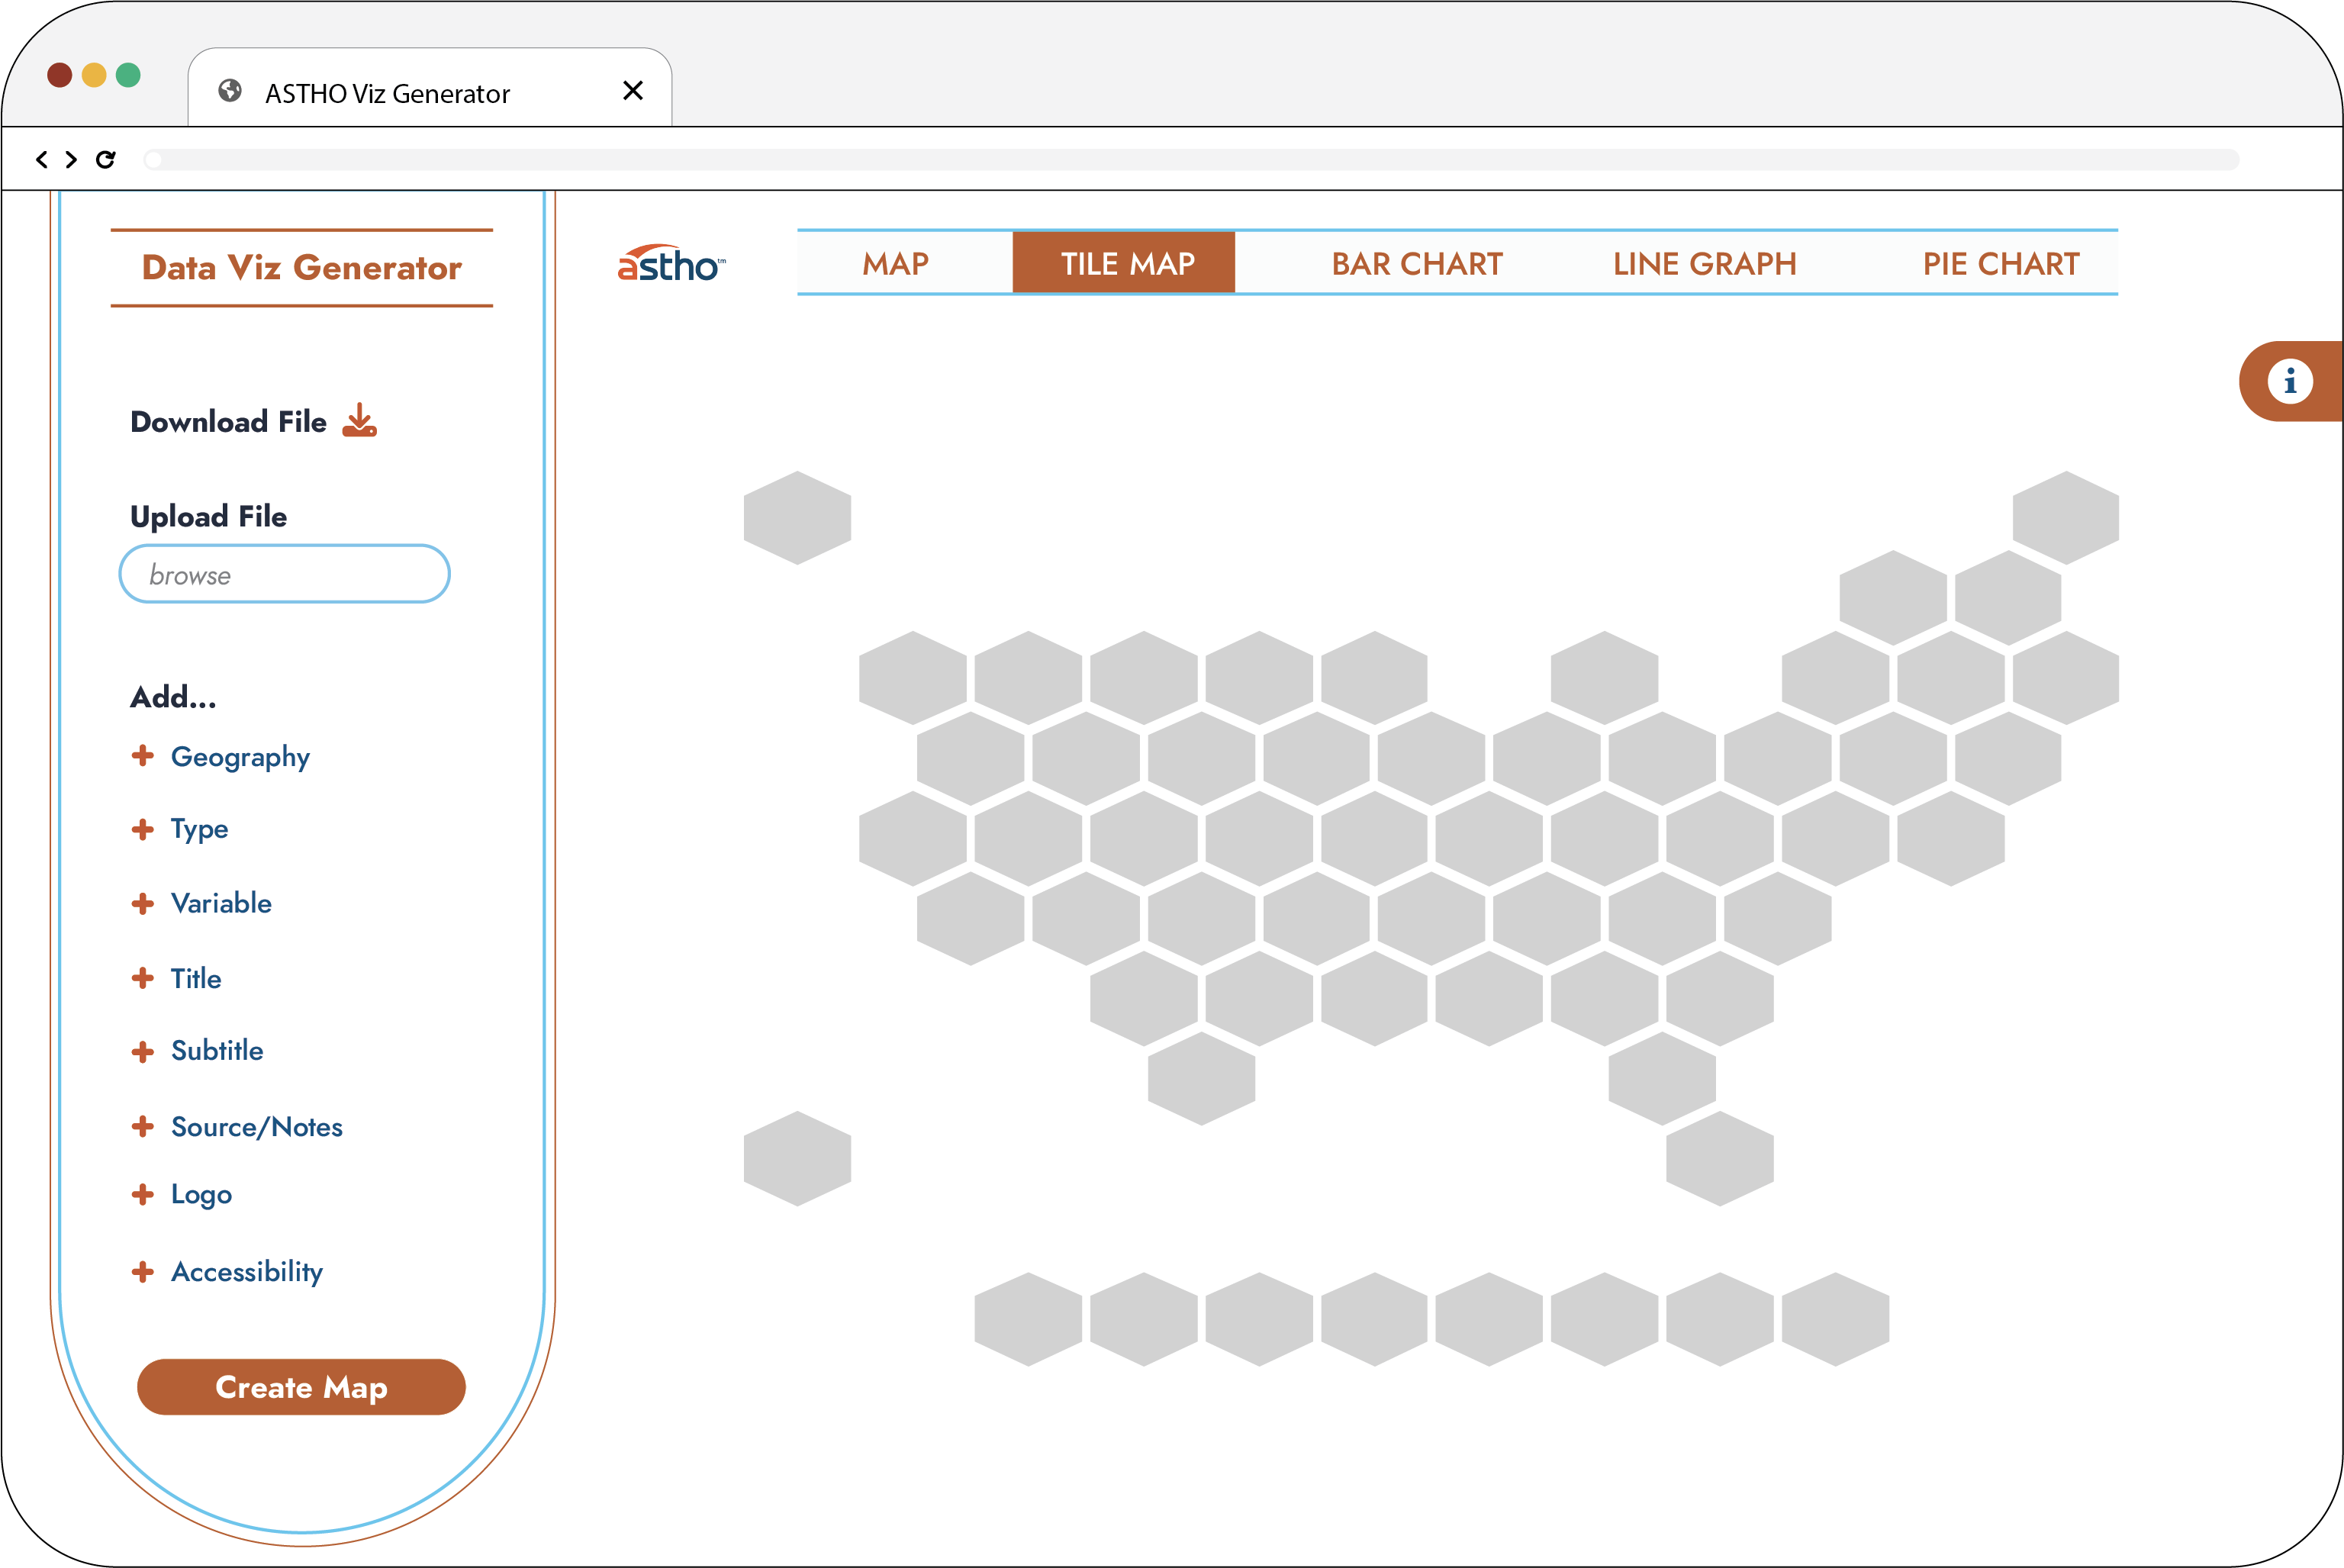
An effort to build a tool that helps non-R users leverage R for data viz.
This effort has just started – but the objective is to develop a shiny application (based on the rendering below) that leverages my {astho.viz} package for data visualization. The goal is to build capacity at my organization for more people to easily develop interactive and static data visualizations that use a consistent style and theme and contain key accessibility features